Update: March 17, 2021. We now have an update with results from the 2019 and 2020 survey waves.
Many thanks to Michael Sadowsky, Peter Hurford, and Galina Hale for assisting our statistical analysis. Thanks to Kelly Anthis for editing and reviewing this report. Also thanks to Kathryn Asher, Cameron Meyer Shorb, Lewis Bollard, Che Green, and others for their feedback on our methodology. Their assistance does not imply they agree with any of the content of this report.
Table of Contents
Exploratory Demographic Analysis |
Introduction
In October 2017, we conducted a survey on attitudes towards animal farming and animal-free food with 1,094 US adults, census-balanced to be representative of age, sex, region, ethnicity, and income.[1][2][3] We had three goals with this survey:
- Provide baseline data for the same survey in future years, so we can assess how public attitudes are changing along with the growth of the animal-free food movement and other factors.
- Test the predictions of researchers and advocates on this topic. If, for example, the public is much more opposed to factory farming and animal farming than we expect, that might suggest we should use stronger messages in our advocacy, e.g. “end animal farming” instead of “end battery cages.”
- Conduct exploratory analysis on the associations between responses and demographics. While we don’t expect this information to make a big difference to advocacy decisions, it could suggest interesting follow-up research questions, for example, how gender, race/ethnicity, and region relate to opposition to animal farming.
Regarding 2, if you would like to note your predictions before seeing the results of the survey, please see this spreadsheet for the question text. The complete survey code can be found in the Appendix.
Main Results
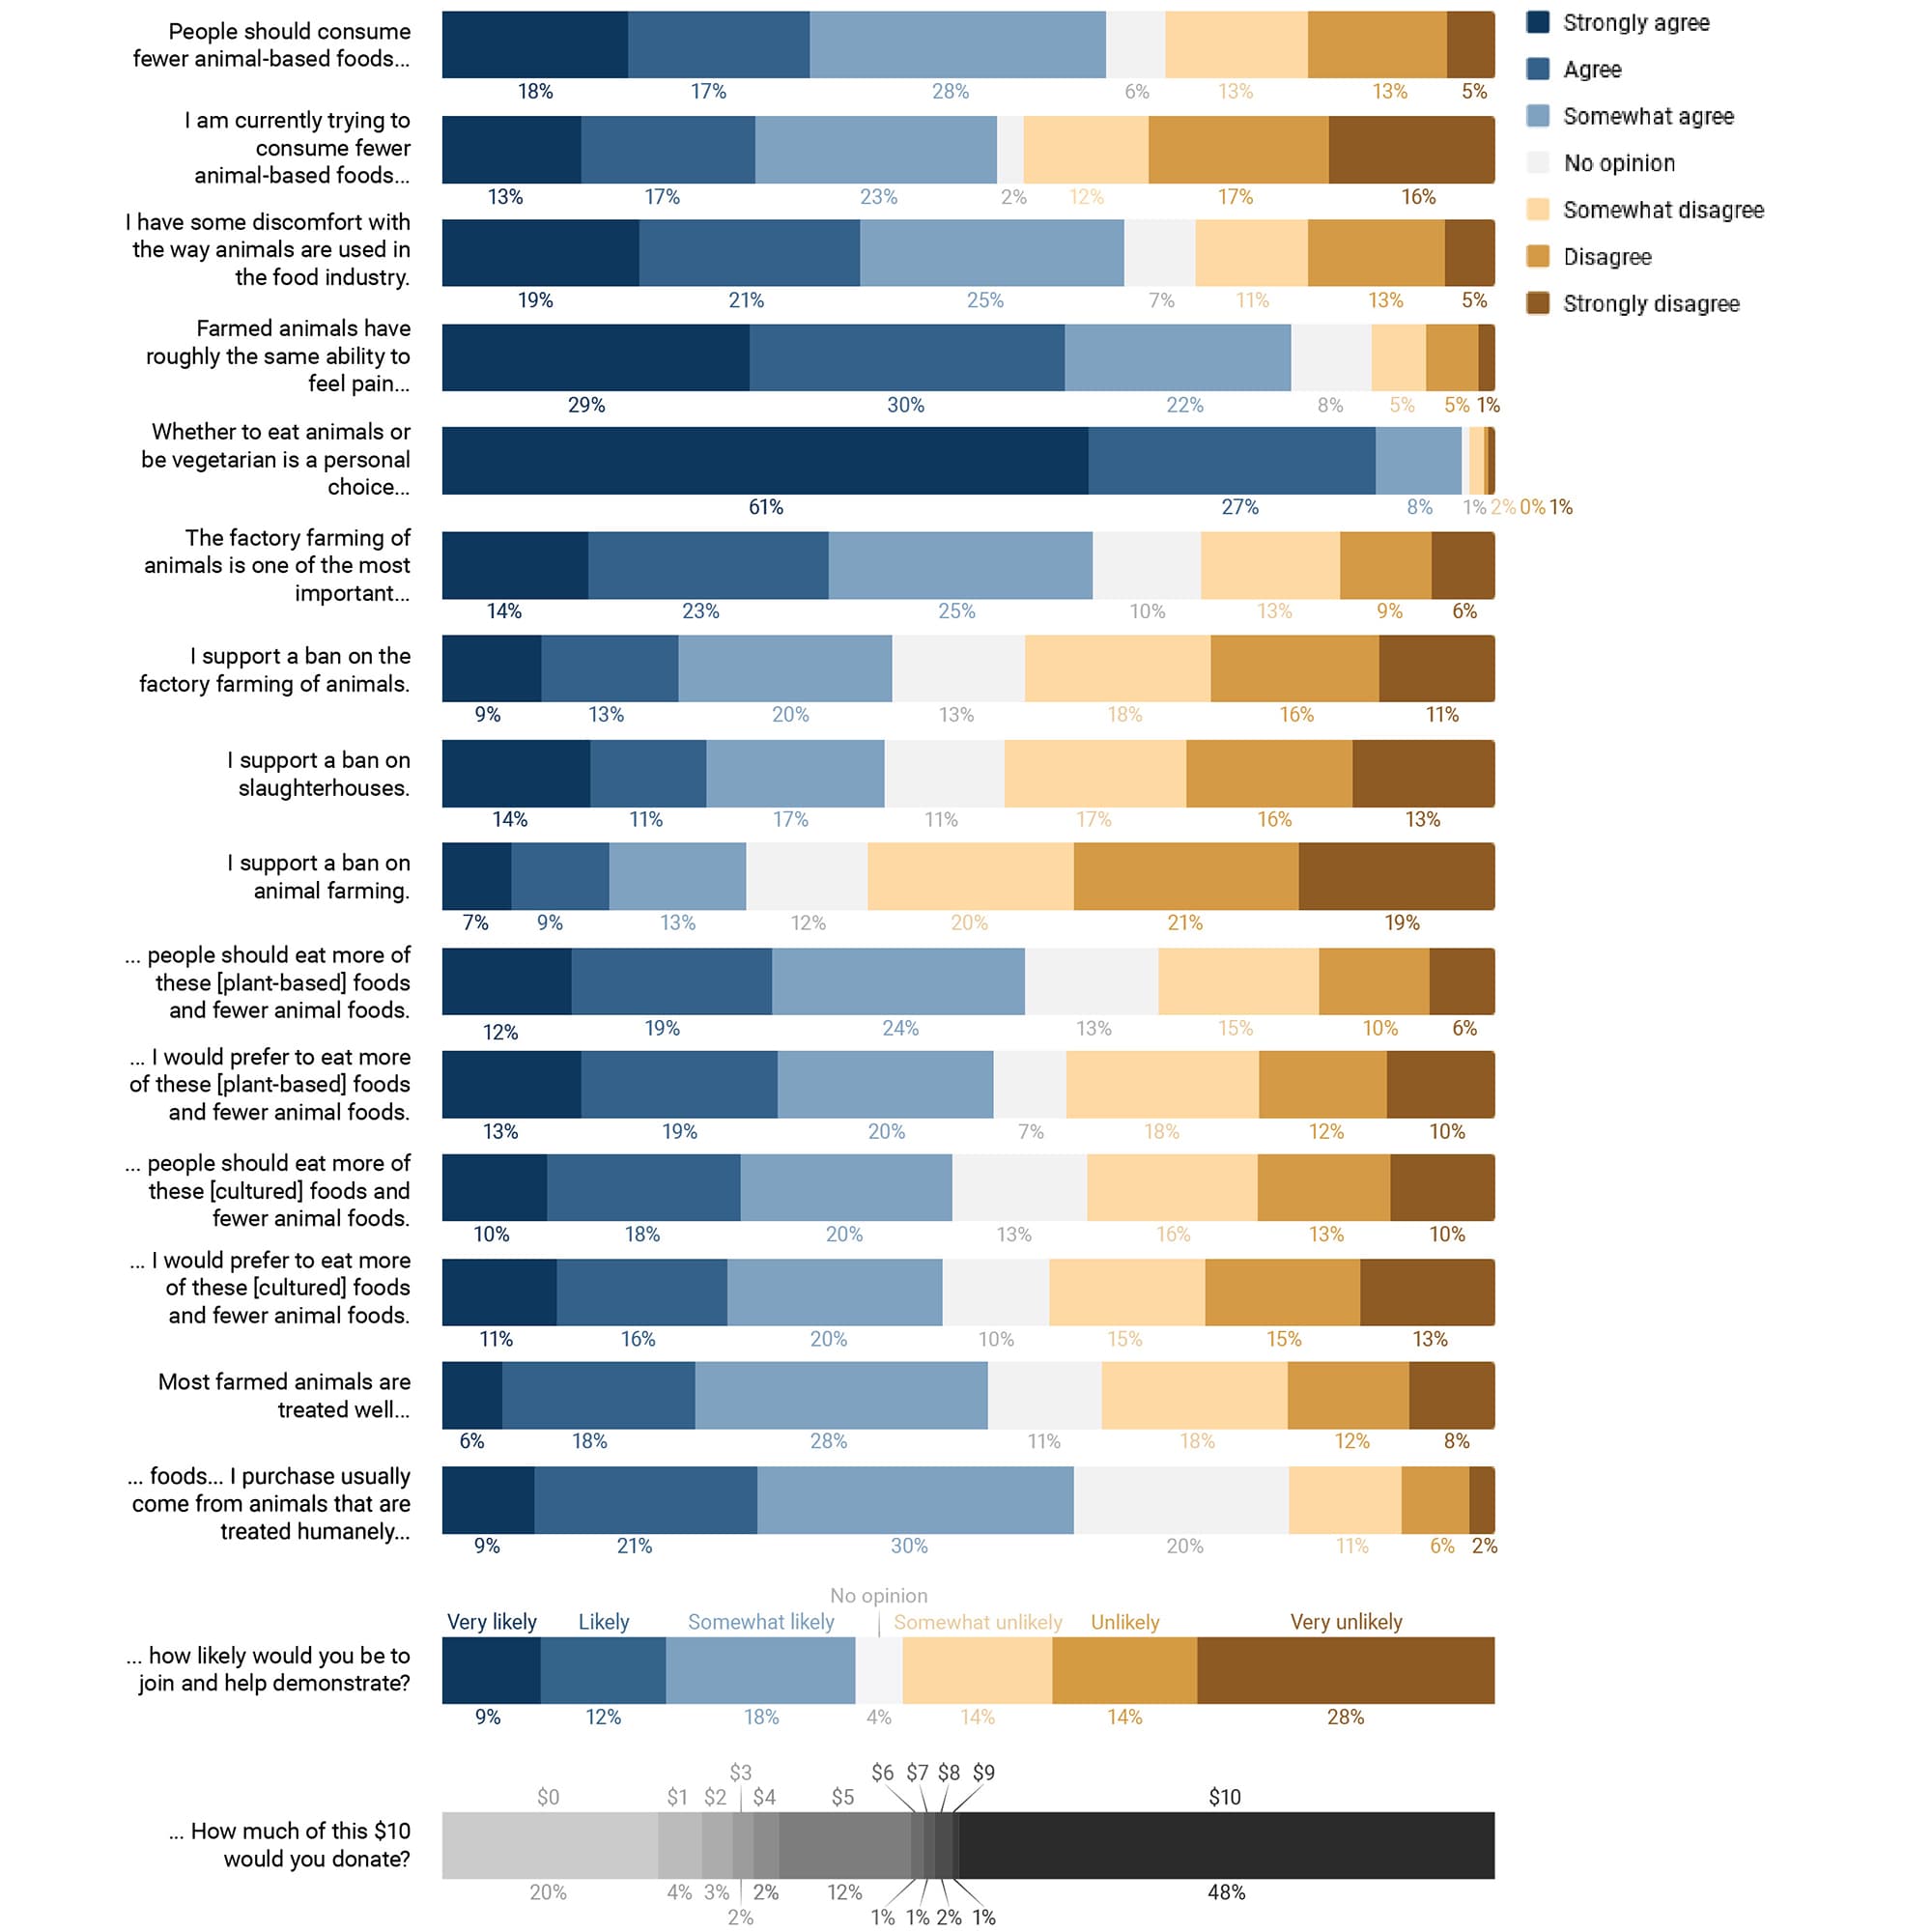
- 54% of US adults say they are “currently trying to consume fewer animal-based foods (meat, dairy, and/or eggs) and more plant-based foods (fruits, grains, beans, and/or vegetables).”
- 97% of US adults agree “Whether to eat animals or be vegetarian is a personal choice, and nobody has the right to tell me which one they think I should do.”
- 49% of US adults support a ban on factory farming, 47% support a ban on slaughterhouses, and 33% support a ban on animal farming. The support for the latter two exceeded even researcher expectations. This suggests that animal-free food advocates might be able to succeed with stronger proposals than they currently use, though readers should take into consideration social desirability bias in this type of survey.
- 58% of US adults think “most farmed animals are treated well,” despite those same estimates and over a decade of undercover investigations in the US and USDA data suggesting over 99% of farmed animals live on factory farms.[4] This suggests either we have insufficient awareness of factory farming, or people have refused to accept the evidence, perhaps due to the emphasis on individual diet change and subsequent cognitive dissonance with their own eating habits.
- 75% of US adults say they usually buy animal products “from animals that are treated humanely,” despite estimates suggesting fewer than 1% of US farmed animals live on non-factory farms.[5] This suggests a psychological refuge effect where people justify their animal product consumption by incorrectly assuming they are eating ethically-produced food.
Methodological notes
We chose Ipsos as a sample provider based on brief discussions with several nationally representative survey providers about their methodologies and costs. We found Ipsos to be very helpful and professional, especially in their patience and flexibility with our many questions and unusual need for rigor. They were also affordable compared to their competitors. We highly recommend Ipsos to any researchers wanting to conduct a similar survey, though researchers should account for the difficulty in getting a survey sample that is census-balanced with education level.
We chose not to randomize the order of questions in the survey because the survey questions were already complex and unusual enough that we wanted to maximize understandability. This could make questions that came later in the survey less comparable with those that came earlier due to priming, anchoring, or social desirability effects. Similarly, we chose not to reverse many questions (e.g. “I do not support a ban on factory farming”) in order to minimize confusion, but we were conflicted about both of these and might have made the wrong decisions.
The introduction to the survey was as follows: “Thank you for participating in this survey. Your honest responses will help researchers better understand public perception of the current food system. Please note that you cannot go back in this survey, so please take your time before clicking on an answer.” We avoided identifying Sentience Institute as the surveyor, or saying anything about advocacy, to minimize any expectations that we wanted them to show more opposition to animal farming in their responses. That being said, this expectation should still be considered when interpreting responses. For more information on social desirability bias in the animal advocacy context, see Animal Charity Evaluators’ write-up on the subject.
We preregistered our predictions and methodology with the Open Science Framework, but didn’t specify how we would conduct exploratory analysis.
The sample provider Ipsos used survey quotas to balance data according to age, gender, region, race/ethnicity, and income. They also collected education data, though they were unable to weight with that metric. We balanced the data, on education and the other demographics, using the raking algorithm of the R package survey. The design effect was 1.438, making the margin of error +/- 3.6%.
Data
Visual
Table
The following table shows the percentage of respondents who agreed with each statement as well as our predictions and how this made us update our beliefs based on (i) whether we made an over- or underestimate and (ii) whether the actual % agreement was inside or outside our credible interval.[6]
We preregistered our predictions as 80% credible intervals (i.e. ranges of percentages that we expect to be right 80% of the time) of how many respondents agreed with the statement out of people who expressed an opinion (i.e. didn’t say “No opinion” or “I do not consume any animal-based foods” for the questions that were potentially confusing for vegan respondents). This percentage of agreement seems like the best single, intuitive metric for popular support.
Question text | Actual % agreement | Predicted % agreement | Update in our beliefs |
People should consume fewer animal-based foods (meat, dairy, and/or eggs) and more plant-based foods (fruits, grains, beans, and/or vegetables). | 66.9% | 38-75% | Weak positive |
I am currently trying to consume fewer animal-based foods (meat, dairy, and/or eggs) and more plant-based foods (fruits, grains, beans, and/or vegetables).[7] | 54.0% | 33-64% | Weak positive |
I have some discomfort with the way animals are used in the food industry. | 69.6% | 63-89% | Weak negative |
Farmed animals have roughly the same ability to feel pain and discomfort as humans.[8] | 87.3% | 71-96% | Weak positive |
Whether to eat animals or be vegetarian is a personal choice, and nobody has the right to tell me which one they think I should do. | 97.5% | 88-97% | Strong positive |
The factory farming of animals is one of the most important social issues in the world today. (A factory farm is a large industrialized farm, especially one on which a large number of livestock are raised indoors in conditions intended to maximize production at minimal cost.) | 68.8% | 25-48% | Strong positive |
I support a ban on the factory farming of animals. | 48.9% | 31-64% | Weak positive |
I support a ban on slaughterhouses. | 47.4% | 15-42% | Strong positive |
I support a ban on animal farming. | 32.5% | 4-30% | Strong positive |
Suppose you were given $10 and allowed to donate any amount of it to an effective non-profit organization that works to help farmed animals, keeping the rest for yourself. How much of this $10 would you donate? | $5.97 | $2.6-7.5 | Weak positive |
Suppose a public demonstration against the problems of factory farming occurred near where you live and your friend asked you to come demonstrate with her. If this demonstration fit into your schedule, how likely would you be to join and help demonstrate? | 41.2% | 29-67% likely | Weak negative |
Please consider the following information before proceeding: In recent years, scientists and chefs have started using plants to create “animal-free” foods that are very similar to meat, dairy, and eggs in their taste, texture, and nutritional profile. When these foods are the same price as animal-based foods, people should eat more of these foods and fewer animal-based foods. | 63.4% | 36-68% | Weak positive |
When these foods are the same price as animal-based foods, I would prefer to eat more of these foods and fewer animal-based foods. | 56.2% | 46-75% | Weak negative |
Please consider the following information before proceeding: Scientists and chefs are also using technology to grow real meat from animal cells without animal slaughter, by feeding those cells with plant-based nutrients so they grow and form muscle fibers, just like they would in an animal’s body. When these foods are the same price as animal-based foods, people should eat more of these foods and fewer animal-based foods. | 55.5% | 26-57% | Weak positive |
When these foods are the same price as animal-based foods, I would prefer to eat more of these foods and fewer animal-based foods. | 52.9% | 31-62% | Weak positive |
Most farmed animals are treated well. For example, the animals are given enough space and kept in good health.[9] | 58.0% | 42-83% | Weak negative |
The animal-based foods I purchase (meat, dairy, and/or eggs) usually come from animals that are treated humanely. For example, the animals are given enough space and kept in good health. | 75.4% | 55-87% | Weak positive |
With the exception of the “personal choice” question, respondents tended to be more opposed to animal farming and more supportive of animal-free foods than we expected, so overall we have updated towards believing that US adults have stronger agreement with the statements we included in the survey. Keep in mind that our predictions were likely very different from the predictions that would be made by the average US adult, or even the average advocate. Our best guess is that others would have expected even more negative results, but this could be a useful area for future research.
These results suggest several interesting avenues for future research, such as:
- How do US attitudes towards animal farming change over time? (We hope to run this survey every 2-5 years if we have sufficient funding.)
- Can focusing on “slaughterhouses” in advocacy, as opposed to “animal farming,” lead to more positive outcomes?
- Have the many US adults who think most farmed animals are treated well simply not been exposed to information, or to a sufficient amount or quality of information, about the prevalence and conditions of US factory farming, or have they been exposed but failed to correctly form beliefs based on that information due to effects like cognitive dissonance?
Exploratory Demographic Analysis
This exploratory analysis was not preregistered and involved testing many hypotheses so they should be taken with large grains of salt. Overall, we found tentative evidence that US adults who identify as Female are more opposed to animal farming than those who identify as Male (14.5% more likely to agree with the average Likert-scale statement[10]), Black (Non-Hispanic) and Hispanic (all races) are more opposed than White (Non-Hispanic) (13.7% and 19.7%), and Northeastern are more opposed than Southern (5.5%).[11] These associations could be explored in future research.
We conducted a linear regression on the data to tease out the relationship between the demographic variables (age, gender,[12] region, race/ethnicity, education, and income) and an intuitive score variable. Score is the sum of all the animal farming attitudes variables, a metric of how opposed to animal farming and supportive of animal-free foods respondents were:
- Excluding the “personal choice” question and the last two questions on humane eating.
- Multiplying the “donation” question by 50% to so all questions are on a 0-6 scale.
- Converting the 6-point Likert scale to a 0 (“Strongly disagree” or “Very unlikely”) through 6 (“Strongly agree” or “Very likely”) numerical scale.
- Treating all “No opinion” or “I do not consume any animal-based foods” as missing data.
- Converting “income” buckets to their average value, e.g. “$25,000-$29,999” became 27,500.
- Converting “education” buckets to their ordinal value, e.g. “grade 4 or less” became 1. Note that this conversation is particularly speculative, but still seemed more useful than considering the variable categorically.
- Weighting data according to census targets, as was done with the main analysis.
We conducted the regression in two ways: first with the 486 responses with missing data for at least one question excluded from the analysis (making the sample size just 608 instead of 1,094), and second using multiple imputation to predict missing data. The first method of excluding data weakens statistical power and could bias estimates if the responses with missing data differed from complete responses. The second method of multiple imputation has more uncertainty based on variation in the missing data insofar as those data don’t just depend on observed data, and it involves more research decision-making than the first method, which makes it more vulnerable to p-fishing and researcher biases.[13]
The first regression results were as follows. There were four p=0.05 significant associations:[14]
Variable | Coefficient | P-Value |
(Intercept) | 3.99 | < 2 * 10-16 *** |
age | -0.0441 | 0.242 |
Gender: Male | -5.81 | 6.21 * 10-6 *** |
Region: Midwest | -2.53 | 0.111 |
Region: Northeast | 3.84 | 0.0311 * |
Region: West | -0.803 | 0.594 |
Race/Ethnicity: Asian (Non-Hispanic) | 1.00 | 0.709 |
Race/Ethnicity: Black (Non-Hispanic) | 6.61 | 0.00206 ** |
Race/Ethnicity: Hispanic (all races) | 7.12 | 6.40*10-5 *** |
Race/Ethnicity: Native American (Non-Hispanic) | 4.78 | 0.443 |
Race/Ethnicity: Other | 1.97 | 0.812 |
Education | 0.419 | 0.0787 |
Income (dollars) | -4.272 * 10-6 | 0.719 |
Signif. codes: 0 ‘***’ 0.001 ‘**’ 0.01 ‘*’ 0.05 ‘.’ 0.1 ‘ ’
The second regression results were as follows. All four associations remained p=0.05 significant:
Variable | Coefficient | P-Value |
(Intercept) | 3.95 | 0.000000 *** |
age | -0.0477 | 0.147 |
Gender: Male | -5.45 | 4.19*10-8 *** |
Region: Midwest | -1.20 | 0.344 |
Region: Northeast | 2.67 | 0.0452 * |
Region: West | 1.02 | 0.406 |
Race/Ethnicity: Asian (Non-Hispanic) | 3.24 | 0.128 |
Race/Ethnicity: Black (Non-Hispanic) | 4.02 | 0.00914 ** |
Race/Ethnicity: Hispanic (all races) | 6.65 | 5.94*10-6 *** |
Race/Ethnicity: Native American (Non-Hispanic) | 4.27 | 0.458 |
Race/Ethnicity: Other | -2.92 | 0.514 |
Education | 0.203 | 0.361 |
Income (dollars) | -7.45 * 10-6 | 0.430 |
Signif. codes: 0 ‘***’ 0.001 ‘**’ 0.01 ‘*’ 0.05 ‘.’ 0.1 ‘ ’
Appendix
The data for this survey can be found here.
This survey was hosted with GuidedTrack, an intuitive, customizable survey and digital tool platform that uses easily-customizable code. The statistical analysis was done with R. Please find the code below, and feel free to reach out to jacy@sentienceinstitute.org with any questions.
GuidedTrack code
>> numberOfQuestions = 18
>> increment = 1/numberOfQuestions
>> progress = 0
>> progress = progress + increment
*progress: {100*progress}%
*Thank you for participating in this survey. Your honest responses will help researchers better understand public perception of the current food system. Please note that you cannot go back in this survey, so please take your time before clicking on an answer.*
Please rate your level of agreement with the following statement:
*question: People should consume fewer animal-based foods (meat, dairy, and/or eggs) and more plant-based foods (fruits, grains, beans, and/or vegetables).
*type: choice
Strongly agree
Agree
Somewhat agree
Somewhat disagree
Disagree
Strongly disagree
No opinion
>> progress = progress + increment
*progress: {100*progress}%
Please rate your level of agreement with the following statement:
*question: I am currently trying to consume fewer animal-based foods (meat, dairy, and/or eggs) and more plant-based foods (fruits, grains, beans, and/or vegetables).
*type: choice
Strongly agree
Agree
Somewhat agree
Somewhat disagree
Disagree
Strongly disagree
No opinion
I do not consume any animal-based foods.
>> progress = progress + increment
*progress: {100*progress}%
Please rate your level of agreement with the following statement:
*question: I have some discomfort with the way animals are used in the food industry.
*type: choice
Strongly agree
Agree
Somewhat agree
Somewhat disagree
Disagree
Strongly disagree
No opinion
>> progress = progress + increment
*progress: {100*progress}%
Please rate your level of agreement with the following statement:
*question: Farmed animals have roughly the same ability to feel pain and discomfort as humans.
*type: choice
Strongly agree
Agree
Somewhat agree
Somewhat disagree
Disagree
Strongly disagree
No opinion
>> progress = progress + increment
*progress: {100*progress}%
Please rate your level of agreement with the following statement:
*question: Whether to eat animals or be vegetarian is a personal choice, and nobody has the right to tell me which one they think I should do.
*type: choice
Strongly agree
Agree
Somewhat agree
Somewhat disagree
Disagree
Strongly disagree
No opinion
>> progress = progress + increment
*progress: {100*progress}%
Please rate your level of agreement with the following statement:
*question: The factory farming of animals is one of the most important social issues in the world today. /(A factory farm is a large industrialized farm, especially one on which a large number of livestock are raised indoors in conditions intended to maximize production at minimal cost.)/
*type: choice
Strongly agree
Agree
Somewhat agree
Somewhat disagree
Disagree
Strongly disagree
No opinion
>> progress = progress + increment
*progress: {100*progress}%
Please rate your level of agreement with the following statement:
*question: I support a ban on the factory farming of animals.
*type: choice
Strongly agree
Agree
Somewhat agree
Somewhat disagree
Disagree
Strongly disagree
No opinion
>> progress = progress + increment
*progress: {100*progress}%
Please rate your level of agreement with the following statement:
*question: I support a ban on slaughterhouses.
*type: choice
Strongly agree
Agree
Somewhat agree
Somewhat disagree
Disagree
Strongly disagree
No opinion
>> progress = progress + increment
*progress: {100*progress}%
Please rate your level of agreement with the following statement:
*question: I support a ban on animal farming.
*type: choice
Strongly agree
Agree
Somewhat agree
Somewhat disagree
Disagree
Strongly disagree
No opinion
>> progress = progress + increment
*progress: {100*progress}%
Please rate your level of agreement with the following statement:
*question: Suppose you were given $10 and allowed to donate any amount of it to an effective non-profit organization that works to help farmed animals, keeping the rest for yourself. How much of this $10 would you donate?
*type: choice
$0
$1
$2
$3
$4
$5
$6
$7
$8
$9
$10
No opinion
>> progress = progress + increment
*progress: {100*progress}%
Please rate your level of agreement with the following statement:
*question: Suppose a public demonstration against the problems of factory farming occurred near where you live and your friend asked you to come demonstrate with her. If this demonstration fit into your schedule, how likely would you be to join and help demonstrate?
*type: choice
Very likely
Likely
Somewhat likely
Somewhat unlikely
Unlikely
Very unlikely
No opinion
>> progress = progress + increment
*progress: {100*progress}%
Please rate your level of agreement with the following statement:
*question: Suppose you were given $10 and allowed to donate any amount of it to an effective non-profit organization that works to help farmed animals, keeping the rest for yourself. If you read this question, please select four dollars. How much of this $10 would you donate?
*type: choice
$0
$1
$2
$3
$4
$5
$6
$7
$8
$9
$10
No opinion
*save: awareness
>> progress = progress + increment
*progress: {100*progress}%
Please consider the following information before proceeding: In recent years, scientists and chefs have started using plants to create “animal-free” foods that are very similar to meat, dairy, and eggs in their taste, texture, and nutritional profile.
Please rate your level of agreement with the following statement:
*question: When these foods are the same price as animal-based foods, people should eat more of these foods and fewer animal-based foods.
*type: choice
Strongly agree
Agree
Somewhat agree
Somewhat disagree
Disagree
Strongly disagree
No opinion
(Reminder) In recent years, scientists and chefs have started using plants to create “animal-free” foods that are very similar to meat, dairy, and eggs in their taste, texture, and nutritional profile.
>> progress = progress + increment
*progress: {100*progress}%
Please rate your level of agreement with the following statement:
*question: When these foods are the same price as animal-based foods, I would prefer to eat more of these foods and fewer animal-based foods.
*type: choice
Strongly agree
Agree
Somewhat agree
Somewhat disagree
Disagree
Strongly disagree
No opinion
I do not consume any animal-based foods.
>> progress = progress + increment
*progress: {100*progress}%
Please consider the following information before proceeding: Scientists and chefs are also using technology to grow real meat from animal cells without animal slaughter, by feeding those cells with plant-based nutrients so they grow and form muscle fibers, just like they would in an animal’s body.
Please rate your level of agreement with the following statement:
*question: When these foods are the same price as animal-based foods, people should eat more of these foods and fewer animal-based foods.
*type: choice
Strongly agree
Agree
Somewhat agree
Somewhat disagree
Disagree
Strongly disagree
No opinion
>> progress = progress + increment
*progress: {100*progress}%
(Reminder) Scientists and chefs are also using technology to grow real meat from animal cells without animal slaughter, by feeding those cells with plant-based nutrients so they grow and form muscle fibers, just like they would in an animal’s body.
Please rate your level of agreement with the following statement:
*question: When these foods are the same price as animal-based foods, I would prefer to eat more of these foods and fewer animal-based foods.
*type: choice
Strongly agree
Agree
Somewhat agree
Somewhat disagree
Disagree
Strongly disagree
No opinion
I do not consume any animal-based foods.
>> progress = progress + increment
*progress: {100*progress}%
*Supplement questions (1/2):*
Please rate your level of agreement with the following statement:
*question: Most farmed animals are treated well. For example, the animals are given enough space and kept in good health.
*type: choice
Strongly agree
Agree
Somewhat agree
Somewhat disagree
Disagree
Strongly disagree
No opinion
>> progress = progress + increment
*progress: {100*progress}%
*Supplement questions (2/2):*
Please rate your level of agreement with the following statement:
*question: The animal-based foods I purchase (meat, dairy, and/or eggs) usually come from animals that are treated humanely. For example, the animals are given enough space and kept in good health.
*type: choice
Strongly agree
Agree
Somewhat agree
Somewhat disagree
Disagree
Strongly disagree
No opinion
I do not consume any animal-based foods.
*if: awareness="$4"
*goto: [survey completion link for awareness check success]
*goto: [survey completion link for awareness check failure]
R code
Sample weighting
Many thanks to Michael Sadowsky for this code.
library(survey)
dat = read.csv(<file>) # file location here
dat$education_recode = NA
dat$education_recode[dat$education %in% c(1,2,3,4)] = 'less_than_high'
dat$education_recode[dat$education %in% c(5,6)] = 'high'
dat$education_recode[dat$education %in% c(7,8)] = 'some_college'
dat$education_recode[dat$education %in% c(9)] = 'associates'
dat$education_recode[dat$education %in% c(10)] = 'college'
dat$education_recode[dat$education %in% c(11,12,13)] = 'post_grad'
dat$sex_race = NA
dat$sex_race[(dat$age<35)&(dat$gender=='Female')] = 'f18_34'
dat$sex_race[(dat$age<55)&(dat$age>=35)&(dat$gender=='Female')] = 'f35_54'
dat$sex_race[(dat$age>=55)&(dat$gender=='Female')] = 'f55_'
dat$sex_race[(dat$age<35)&(dat$gender=='Male')] = 'm18_34'
dat$sex_race[(dat$age<55)&(dat$age>=35)&(dat$gender=='Male')] = 'm35_54'
dat$sex_race[(dat$age>=55)&(dat$gender=='Male')] = 'm55_'
dat$income_recode = NA
dat$income_recode[dat$income<25000] = '_24999'
dat$income_recode[(dat$income>=25000)&(dat$income<50000)] = '25000_49999'
dat$income_recode[(dat$income>=50000)&(dat$income<75000)] = '50000_74999'
dat$income_recode[(dat$income>=75000)&(dat$income<100000)] = '75000_99999'
dat$income_recode[(dat$income>=100000)] = '100000_'
educ_dist <- data.frame(education_recode = c('less_than_high','high',
'some_college','associates',
'college','post_grad'),
Freq = nrow(dat) * c(0.112, 0.291,
0.1889,
0.096,
0.202,
0.111))
sex_race_dist <- data.frame(sex_race = c('f18_34','f35_54',
'f55_','m18_34',
'm35_54','m55_'),
Freq = nrow(dat) * c(0.1472, 0.176,
0.1947,
0.1478,
0.1685,
0.1658))
region_dist <- data.frame(region = c('Northeast','Midwest',
'South','West'),
Freq = nrow(dat) * c(0.1781,0.2106,0.3551,
0.2361))
income_dist <- data.frame(income_recode = c('_24999','25000_49999',
'50000_74999','75000_99999',
'100000_'),
Freq = nrow(dat) * c(0.1593,0.2118,0.1860,
0.1384,0.3045))
raceethnicity_dist <- data.frame(raceethnicity = c('White (Non-Hispanic)',
'Black (Non-Hispanic)',
'Asian (Non-Hispanic)',
'Other',
'Hispanic (all races)',
'Native American (Non-Hispanic)'),
Freq = nrow(dat) * c(0.6486,0.1165,
0.0556,0.0175,0.1557,
0.0061))
small.svy.unweighted <- svydesign(ids=~1, data=dat)
small.svy.rake <- rake(design = small.svy.unweighted,
sample.margins = list(~education_recode,~sex_race,~region,~income_recode,~raceethnicity),
population.margins = list(educ_dist,sex_race_dist,region_dist,income_dist,raceethnicity_dist))
dat$weight = weights(small.svy.rake)
deff = (nrow(dat)*sum(dat$weight^2))/(sum(dat$weight)^2)
print(deff)
Linear regressions
#get mice library for multiple imputation
#install.packages("mice") if you don't have it on your computer
library(mice)
#relevel raceethnicity for largest group
dat <- within(dat, raceethnicity <- relevel(raceethnicity,ref=6))
#relevel region for largest group
dat <- within(dat, region <- relevel(region,ref=3))
#generate dependent variable
dat$score <- dat$generalpb + dat$personalpb + dat$discomfort + dat$sentience + dat$importance + dat$banff + dat$banslaughter + dat$banaf + dat$donate/2 + dat$demonstration + dat$generalspb + dat$personalspb + dat$generalcultured + dat$personalcultured
#linear regression, excluding missing data
fit <- lm(data=dat, weights=weights, score ~ age + gender + region + raceethnicity + education + income)
#linear regression, multiple imputation for missing data
#set up to get missing scores along with imputation
#make mids object out of data (this isn't imputing anything yet)
ini <- mice(dat, max=0)
#tell mice() how to impute missing scores
meth <- ini$meth
meth["score"] <- "~I(generalpb + personalpb + discomfort + sentience + importance + banff + banslaughter + banaf + donate/2 + demonstration + generalspb + personalspb + generalcultured + personalcultured)"
#tell mice() not to use ID or score as predictors
pred <- ini$pred
pred[, "ID"] = 0
pred[, "score"] = 0
#impute! use print=FALSE if you don't want to see progress
imput <- mice(dat, seed=500, m=10, maxit=50, pred=pred, meth=meth)
#fit a linear model on the imputed data
fit2 <- with(data=imput,weights=weights,exp=lm(score ~ age + gender + region + raceethnicity + education + income))
combine <- pool(fit2)
#show linear model outputs
summary(fit)
summary(combine)
[1] This is the number of complete responses which passed the awareness check. An unusually large number of respondents failed the awareness check, 46.3% of the 2438 total submissions. We did have a more challenging awareness check than many surveys, which was after the “public demonstration” question and read: “Suppose you were given $10 and allowed to donate any amount of it to an effective non-profit organization that works to help farmed animals, keeping the rest for yourself. If you read this question, please select four dollars. How much of this $10 would you donate?”
[2] We also collected education information from subjects, but this was not part of Ipsos’ survey quotas. We (Sentience Institute) included it in our sample weights.
[3] The sample for this survey was provided by Ipsos with all questionnaire design, data analysis, and reporting by Sentience Institute. Ipsos used its I-Say panel, as well as Research Now and Market Cube.
[4] See calculations in this spreadsheet using the number of animals per farm as the best available proxy for whether it’s a CAFO, with assumptions including that all Large CAFOs are factory farms, the upper half of Medium CAFO-sized farms are factory farms, and no Small CAFO-sized farms are factory farms. Note that over 95% of farmed animals are chicken and fish. We lack census data for fish farm size, but consensus in the field seems to be that virtually all fish farms are factory farms in terms of confinement, disease, and other metrics.
Chickens raised for meat: 99.84-99.93%
Chickens raised for eggs: 98.71-98.99%
Turkeys: 99.34-99.77%
Pigs: 95.78-97.88%
Cows: 50.10-79.332%
[5] Ibid.
[6] Our credible intervals didn’t specify midpoints, so we’re just taking those as the midpoint of the range.
[7] National Public Radio and Truven Health Analytics (2016) asked in March 2012 and December 2015, “Would you say that you eat more, less or about the same amount of meat now as you did 3 years ago?”
2012: 6.0% more, 39.1% less, 54.9% “about same.”
2015: 8.5% more, 32.1% less, 59.3% “about same.”
[8] Lusk et al (2007) asked in a US telephone survey how much respondents agreed with, “Farm animals have roughly the same ability to feel pain and discomfort as humans.” and got 81% agreement, 5% neither agree nor disagree, 12% disagreement, and 3% “don’t know.”
[9] Greenberg (2017) asked a similar question of Amazon Mechanical Turk respondents, “Do you think that animals suffer a lot when they are raised on farms for our food?” 43% of respondents said “Yes,” 11% said “No,” and 46% said “I’m not sure.” Greenberg also discussed his results in the 80,000 Hours Podcast.
[10] This is not the difference we analyzed for statistical significance, but we include it here because it’s a more intuitive indication of the size of the differences than differences in overall score.
[11] We used the largest demographics as the baseline for the categorical demographic variables, but one could do other pairwise connections like between Northeastern and Midwestern.
[12] These demographic questions were implemented by the survey provider, rather than by Sentience Institute. Our preferred language would be to use gender to refer to men, women, and other genders, while sex would refer to male and female. But since the respondents answered the question asking for their gender, with the choices of male or female, we are presenting the data that way.
[13] Some researchers also worry about using multiple imputation with large amounts of missing data. For example, six of our variables had more than 10% missing data (the question about personal consumption of humane animal-based foods even had 20%). We felt comfortable including these variables because we are only using the imputation for exploratory regression and factor analysis. If we were aiming for prediction or confirmatory analysis, we would be more cautious.
[14] These p-values do not include adjustments for multiple hypothesis testing.